Behind every forecast lies a story of precision, integration, and intelligent processing. At MeteoA, our method connects the dots between local measurements, advanced meteorological modelling, and AI-powered interpretation — delivering weather intelligence that’s accurate, relevant, and actionable.


Step 1
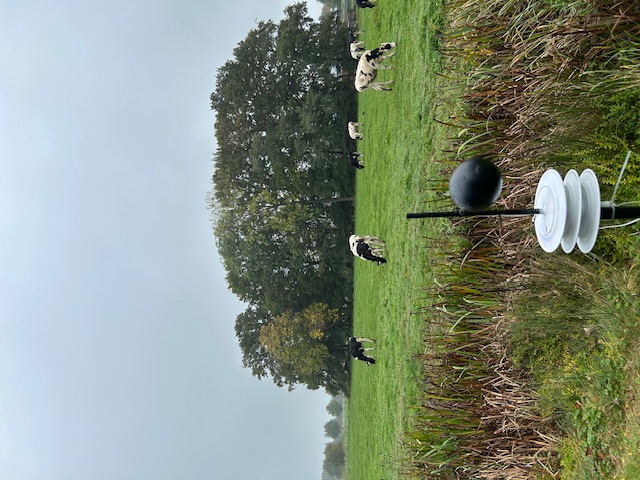
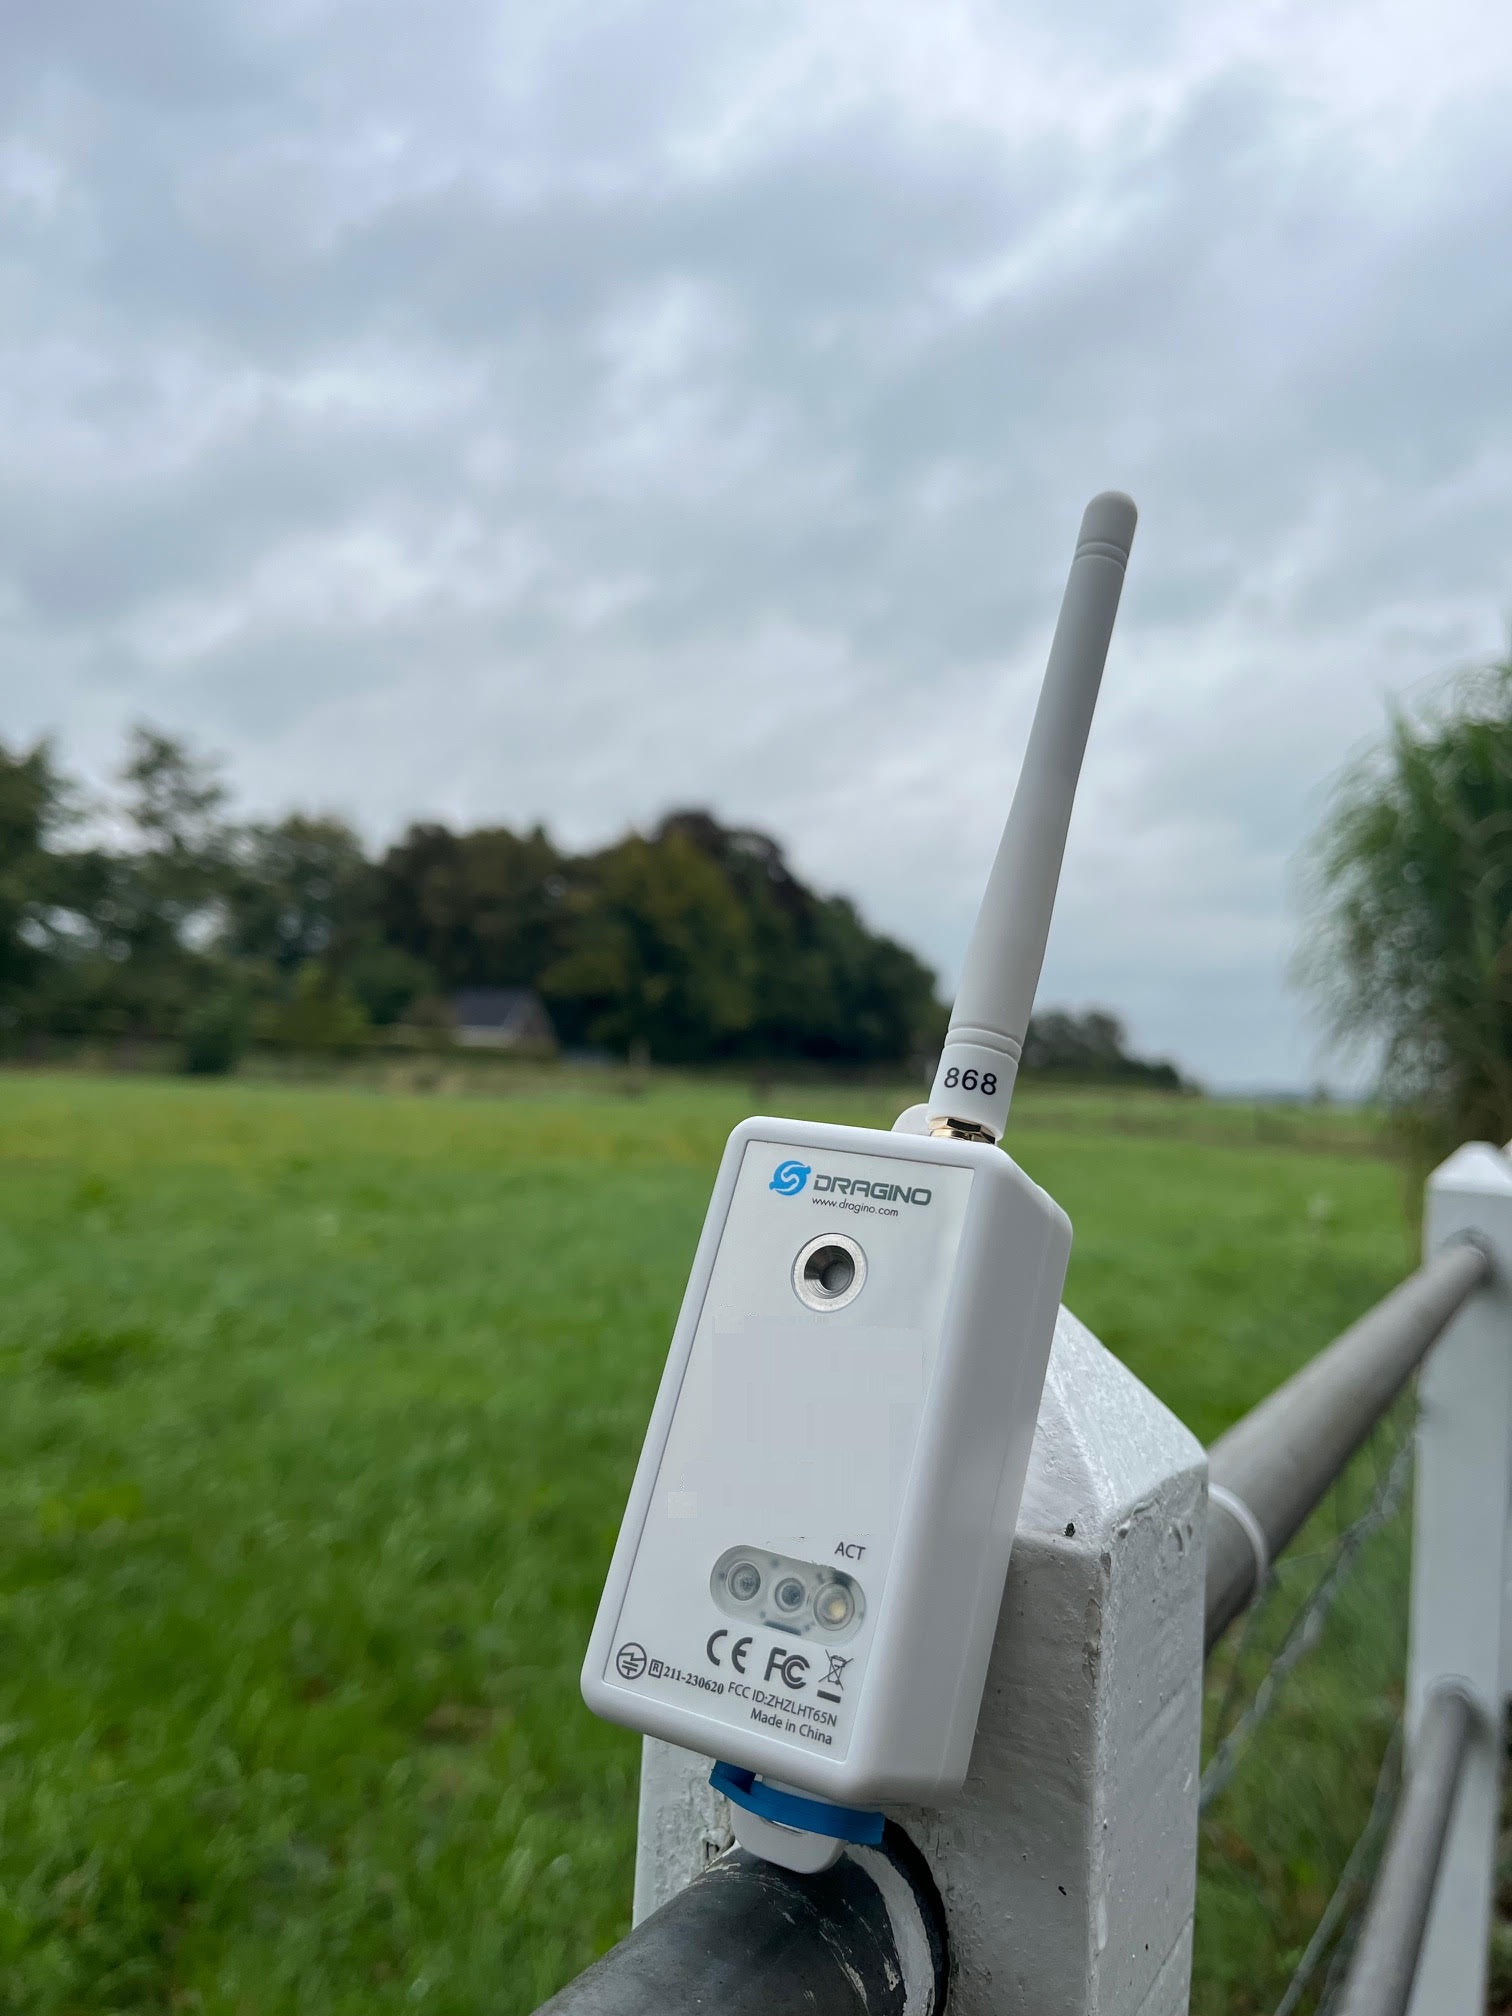
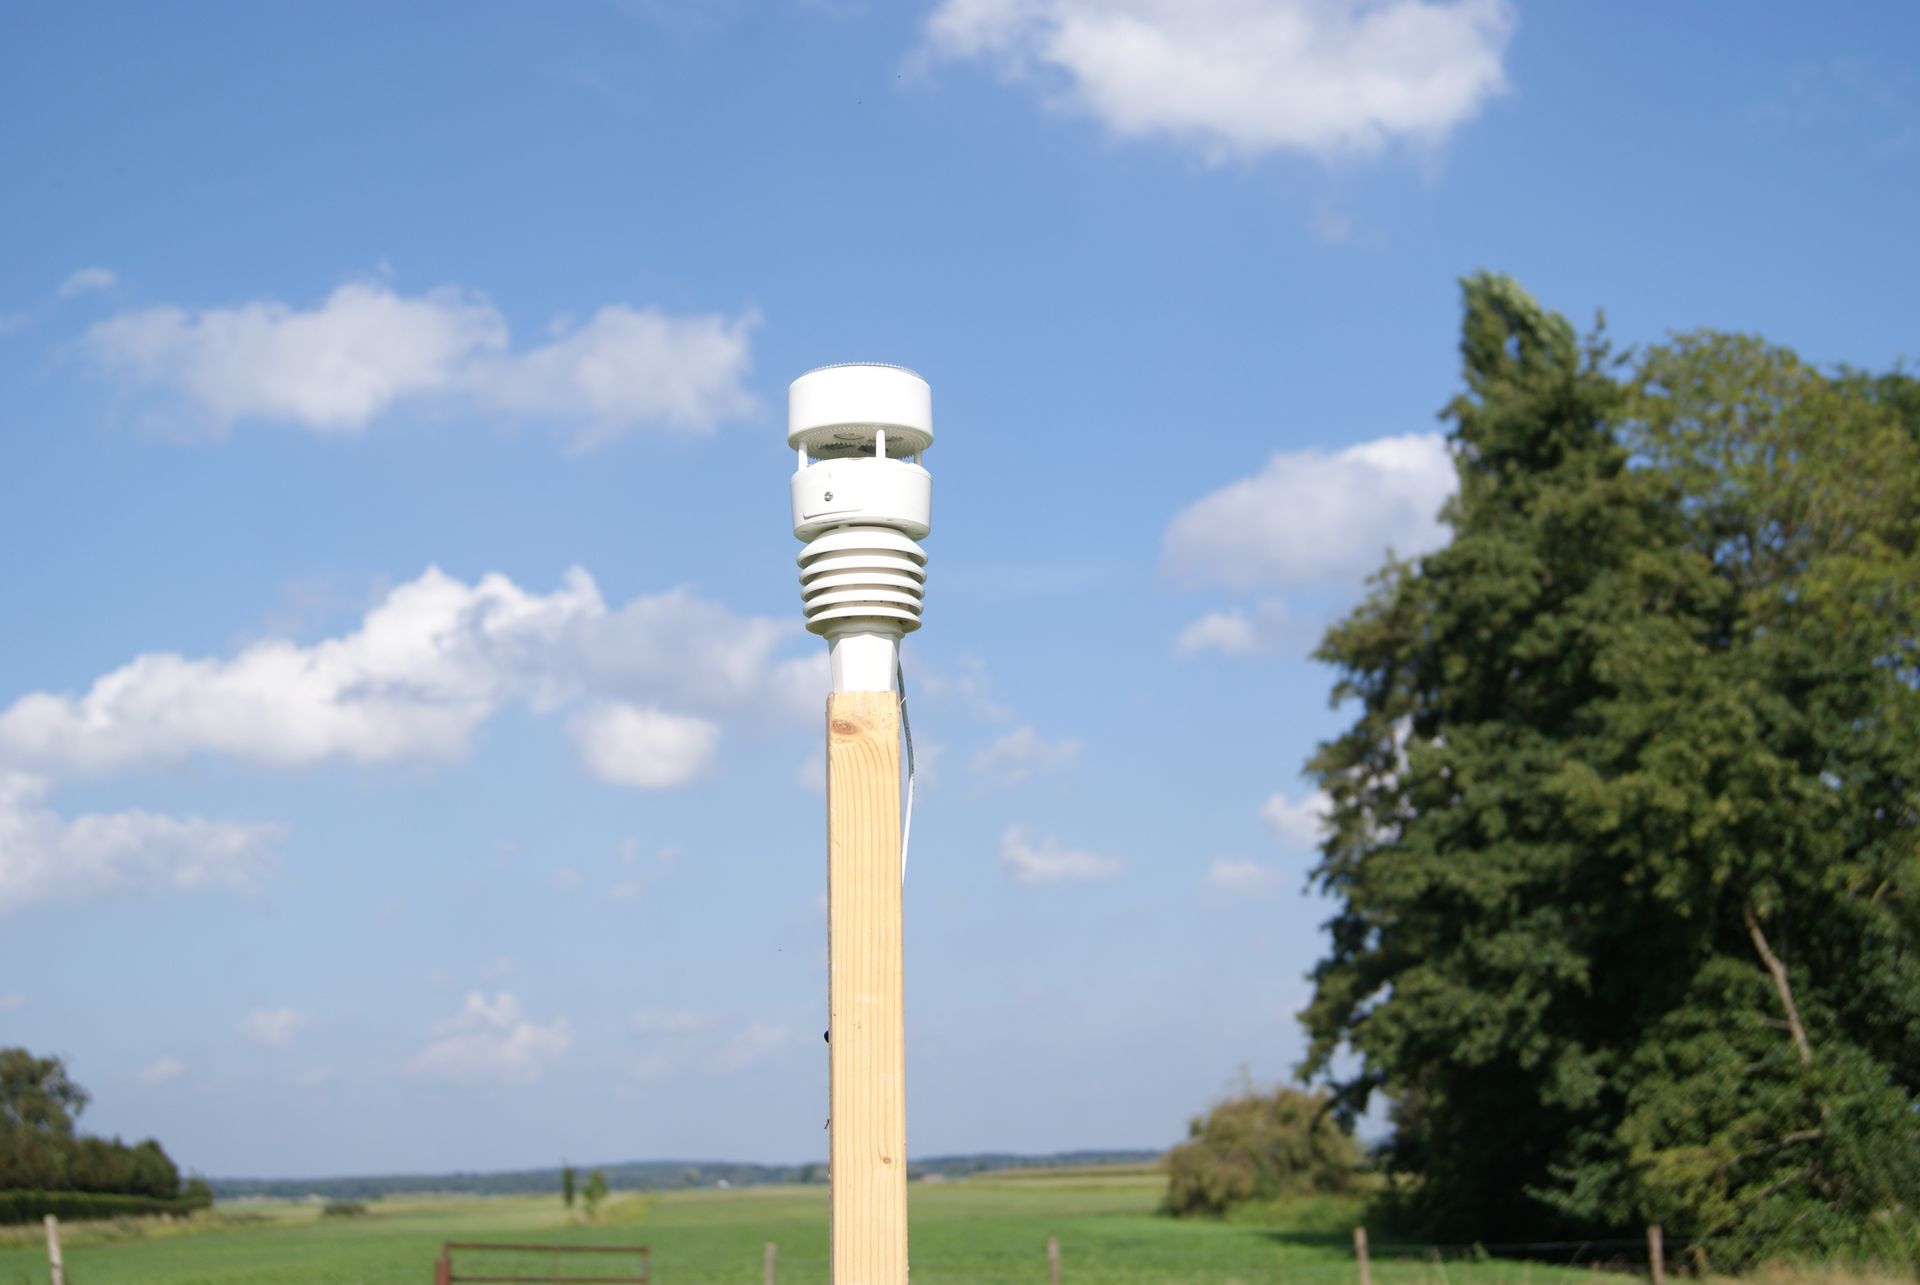
It all starts with data you can trust. MeteoA installs and maintains professional-grade weather stations tailored to each location. Every sensor — from temperature and humidity to solar radiation and wind — captures the details that make your environment unique.
Learn more about instruments and costs ➔
A cost effective method to measure dry bulb and black globe temperature, allows calculating heat stress indices (e.g. WBGT)
Our simplest and smallest weather station, includes dry bulb air temperature and humidity sensors.
Mid-range weather station measuring windspeed, rainfall, dry bulb temperature and humidity. Sonic anemometer and haptic rain gauge.
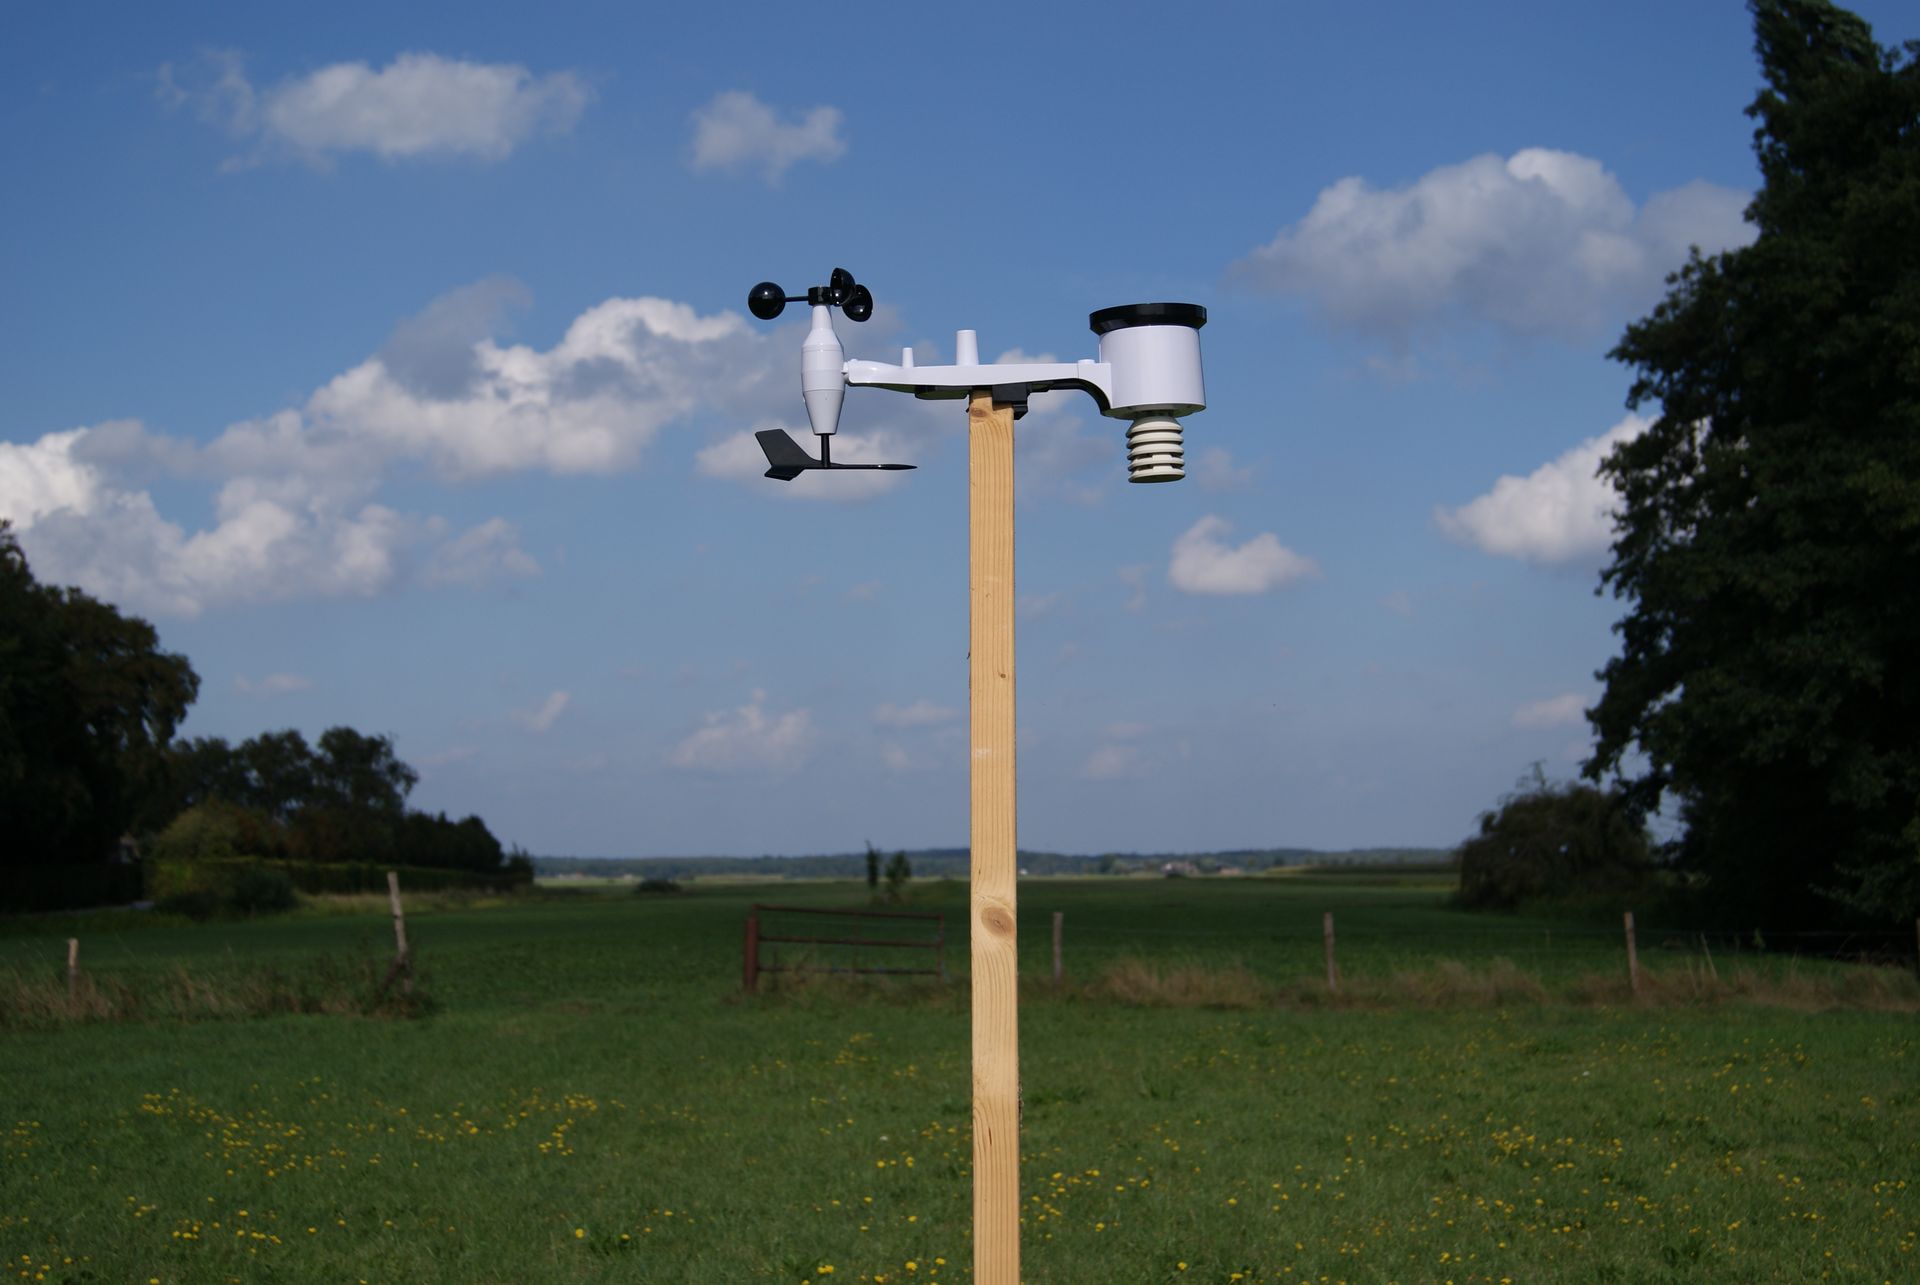
Full suite weatherstation measuring windspeed, rainfall, dry bulb temperature and humidity. Includes cup and vane anemometer and tipping bucket rain gauge.
Step 2
Local doesn’t mean isolated. Your on-site data is combined with trusted national and international meteorological models, radar imagery, and satellite observations. This multi-source integration builds a complete and resilient weather picture — from ground level to cloud top.
Utilizing data from ECMWF, 12-72 hour forecasts data is included

Satellite products for the European region, including cloud, rain, air quality and solar radiation

Accessing data from nearby official KNMI weather stations enhances capabilities.
Step 3
Our AI models continuously analyze and blend incoming data streams, learning from real-time discrepancies between forecasts and actual measurements. The result: more accurate, location-specific predictions that improve over time.